Tips for Beginners to Easily Analyze Crypto Charts
Analyzing crypto charts can seem intimidating at first, but it’s simpler than you might imagine.
If you’re starting out in the world of cryptocurrencies, you’ve probably already come across those charts full of colored lines and numbers that look like an impossible puzzle to solve.
The good news is that understanding these charts doesn’t require advanced math knowledge or years of experience in the financial market.
The secret is to start with the fundamentals and move forward gradually, building your knowledge in a solid and consistent way.
Throughout this guide, you will discover proven techniques that will transform your view about cryptocurrency charts.

How Do Crypto Charts Work?
Crypto charts are visual representations of a cryptocurrency’s price movements over time. Each point on the chart shows the value of the coin at a specific moment, creating a line that reveals important patterns and trends.
Fundamental elements of the charts:
- Horizontal axis: represents time (minutes, hours, days)
- Vertical axis: shows the price of the cryptocurrency
- Candlesticks: bars that indicate open, close, high, and low
- Volume: amount of coins traded during the period
The most common type of crypto chart uses candlesticks, which are like little colored candles. Each candlestick represents a specific period and contains four key pieces of information: opening price, closing price, highest value, and lowest value reached.
The colors of the candlesticks have specific meanings. Usually, green or white indicates that the price closed above the opening, while red or black shows that it closed below. This visual information allows you to quickly identify whether it was a positive or negative period.
Understanding these basic elements is the first step to interpreting any chart.
Main Indicators for Analyzing Charts
Technical indicators are mathematical tools that help interpret price movements in the crypto market. They turn historical data into useful information to forecast possible future price directions.
Moving Average
The moving average is probably the most important indicator for beginners. It smooths out price fluctuations and shows the general direction of the trend. When the price is above the moving average, it generally indicates an uptrend.
RSI (Relative Strength Index)
The RSI is another key indicator, ranging from 0 to 100. Values above 70 suggest that the crypto may be overbought, while values below 30 indicate possible oversold conditions. This information helps identify moments to enter and exit.
MACD
MACD combines different moving averages to show changes in trend strength. When the lines cross, it may signal a change in the price direction of the cryptocurrency.
Remember: No indicator is perfect in isolation. Combining several indicators offers a more complete view of the crypto market.
Indicators-for-chart-analysis-(Source-Google)
How to Identify Uptrends and Downtrends in Cryptocurrencies
Identifying trends is one of the most valuable skills when analyzing crypto charts. A pattern indicates the overall path of value changes during a particular timeframe.
Characteristics of an uptrend (bullish):
- Higher highs and higher lows
- Price consistently above the moving averages
- Increasing volume during rises
- Predominance of green candlesticks
A bullish trend is defined by consecutive rising highs and lows forming an upward sequence.
This formation demonstrates that investors are prepared to purchase at progressively elevated price levels for the cryptocurrency.
Signs of a downtrend (bearish):
- Lower highs and lower lows
- Price below the main moving averages
- High volume during drops
- Predominance of red candlesticks
Downtrends follow the opposite pattern, with descending peaks and valleys. Sellers are willing to accept lower and lower prices, creating selling pressure on the cryptocurrency.
There are also sideways trends, where the price oscillates within a specific range with no clear direction. During these periods, it’s important to wait for a definition before making investment decisions.
Online Tools for Monitoring Crypto Charts
The market offers several platforms to analyze cryptocurrency charts, each with specific features that suit different user profiles. Selecting the appropriate platform may significantly impact your analytical results and evaluation outcomes.
TradingView
TradingView is considered the gold standard for crypto technical analysis. It offers a vast library of indicators, drawing tools, and the ability to share analyses with other users. The platform’s design is user-friendly including for newcomers.
CoinGecko
For those seeking simplicity, CoinGecko provides clean charts with essential information about prices, volume, and market capitalization. It’s ideal for daily tracking without technical complications.
Binance
Exchanges like Binance offer charts integrated into their trading platforms. This allows you to analyze and execute trades in the same environment, speeding up the decision-making process.
Tips for choosing your tool:
- Consider your experience level
- Check if it offers the cryptos you follow
- Test different interfaces before deciding
Several of these tools provide complimentary editions with sufficient capabilities for fundamental evaluation. Begin with a basic platform and advance as your knowledge grows.
How to Combine Chart Analysis with Other Strategies
Chart analysis is powerful, but it works best when combined with other crypto investment approaches. This combination gives a more complete view of the market and reduces unnecessary risks.
Fundamental analysis examines the technical and commercial aspects of a cryptocurrency. While charts show price movements, fundamental analysis reveals whether the project has real value and sustainable growth potential.
Crypto market sentiment is influenced by news, regulations, and public opinion. Following this information helps understand why prices move in certain ways on the charts.
Capital protection is crucial for safeguarding your investment funds. Establish exit points and profit targets prior to opening any trade. Technical analysis assists in finding optimal locations for these commands.
Practical example of combination:
- Use charts to identify technical entry points
- Confirm with fundamental analysis whether the project is strong
- Monitor sentiment to avoid market traps
- Apply risk management to protect investments
This combined strategy considerably enhances your probability of achieving positive results in the crypto market.
Cryptocurrency-Charts-(Source-Google)
Basic Glossary: Most Used Terms in Charts
Mastering the technical language is essential for understanding analyses and discussions about charts. This glossary presents the most important terms you’ll encounter regularly.
- Candlestick: graphic element displaying opening, closing, maximum, and minimum values
- Support: price level where buying tends to overcome selling
- Resistance: level where selling tends to overcome buying
- Breakout: breaking of key support or resistance
- Volume: amount of crypto traded during a specific period
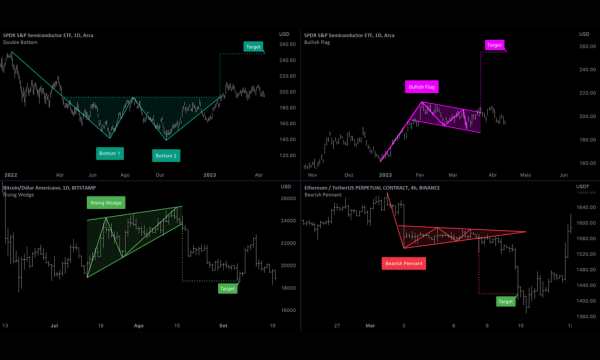
Common chart patterns:
- Head and Shoulders: reversal pattern with three peaks
- Double Top/Bottom: two peaks or valleys at the same level
- Triangle: consolidation with price convergence
- Flag: small pause during a strong trend
Basic indicators:
- MA (Moving Average): moving average of prices
- RSI: relative strength between buys and sells
- MACD: moving average convergence and divergence
Conclusion
Learning to analyze crypto charts is a journey that requires constant practice and patience to develop your skills.
With the information presented in this guide, you have a solid foundation to begin your analyses consistently and informatively.
Remember that chart analysis is a tool—not a guarantee of results. The cryptocurrency market is volatile and unpredictable, but understanding chart patterns certainly increases your chances of making more accurate decisions.
With dedication and continuous study, you will develop the confidence needed to navigate the fascinating world of charts.
 What Are the Share Market Trends for the Coming Years?
The share market is changing, and you can grow with it. Keep reading and learn more about this universe! Ad The share market is in constant […]
Keep reading How Blockchain Is Revolutionizing the Financial Sector
Understanding what blockchain is means understanding the future financial. Ad If you’ve heard of blockchain, you know it’s a topic that’s changing the world, especially the […]
Keep reading 6 Essential Tips to Protect Your Crypto Investments
Exploring the digital world and making your crypto investments can be an exciting journey full of opportunities. Ad However, as with any promising venture, taking crucial […]
Keep reading